


Big data analytics in transportation: Key use cases


May 21, 2026 11 min read 135 views
The modern transportation system is the river of data flowing behind the scenes. Every scan at a distribution hub, every GPS ping, every engine sensor, every driver maneuver, every weather shift, and every customer update feeds into this stream. But here’s the thing: most of that data comes in fast, messy, and there’s a ton of it. If teams don’t act on it right away, it just becomes background noise.
This is where real-time data and a solid data cloud step in. They’re now essential to how transportation and logistics actually run. With the proper setup, teams spot disruptions before they snowball, predict failures before they even happen, and send trucks or cargo exactly where demand is building. Instead of constantly scrambling to put out fires, operations become smoother and more predictable. That’s what intelligent transportation really means: algorithms that tweak routes on the fly, models that nail last-mile demand forecasts, and systems that turn exceptions into automatic responses. In this article, we’ll dive into the best ways transportation companies use big data analytics and how they turn raw, chaotic telemetry into tangible, measurable results.
Key takeaways on big data in transportation planning
- Big data improves transportation management. It takes all those signals from fleets and networks and turns them into quick, smart decisions that keep things moving.
- The most significant benefits of big data appear in routing, maintenance, and last-mile delivery, where small gains compound daily.
- In transport and logistics, mixing what’s happened in the past with what’s happening right now makes it easier to keep service reliable, even when things get messy.
- But none of this works without solid data management. Get that right, and analytics become dependable, scalable, and valuable for everyone on the team.
The complexity of global transportation and logistics networks
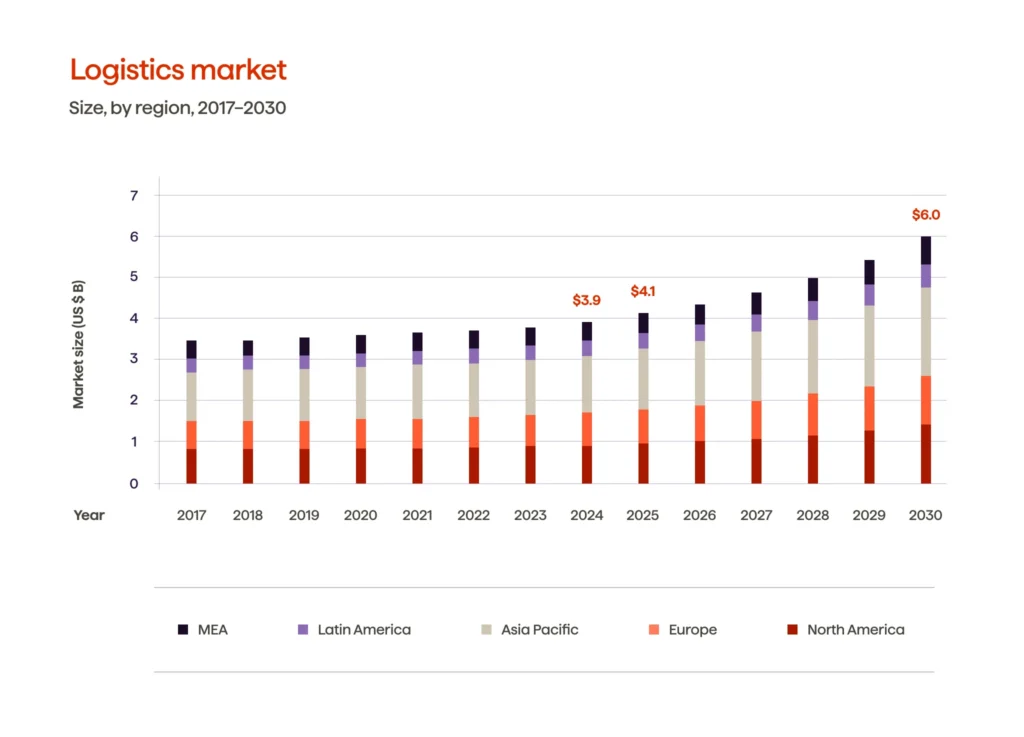
Modern logistics is a beast—no wonder it’s so complicated. Grand View Research puts the global logistics market at $3.8 trillion in 2023, and it’s barreling toward nearly $6 trillion by 2030. That’s about 7% annual growth. With that kind of expansion, supply chains are getting tangled across more routes and more partners, while everyone expects faster, smoother service. And let’s be honest, disruptions are popping up more often, and fixing them costs even more.
The global transportation industry doesn’t work like a straight line—it’s more like a living organism, constantly reacting and shifting. One shipment might bounce between different carriers, move by road, rail, air, and sea, and with each handoff adding another chance for delay. And the holdups never stick to one spot. Today it’s a jammed port, tomorrow it’s a packed warehouse, then suddenly you don’t have enough drivers for that last stretch. Throw in a thunderstorm or some surprise roadwork, and delivery times can flip within hours. Even something that looks easy, like sending a truck around traffic downtown, can set off a chain reaction, including missed transfer windows, inventory out of place, and the whole thing out of sync.
This is the inflection point when transportation analytics and data science go from informing you about what has happened to providing you with tools to take control. You will need ongoing analysis of current operational signals (e.g., scan events, fleet telemetry, and, most importantly, live traffic data). Your ETA accuracy and route planning depend on near-real-time data around you, not just written documentation. Intelligent transportation will provide advanced methods for monitoring traffic flow through real-time traffic sensing and advanced decision-making; this, in turn, will allow you to identify issues early and maintain smooth traffic flow. Implementing this type of thought process into your business produces smart transportation, such as dynamic routing, early warnings to identify exceptions, and automated solutions that help maintain high service levels despite disruptions to your network.
Data processing at scale: ingestion, streaming, and governance for transportation data
Transportation data is typically high-volume, high-speed, and low-quality. You could have one data set that contains hundreds of thousands of GPS pings every few seconds, CAN Bus telemetry signals from the vehicles, driver event data from Driver Applications, scanned event data from U-Box hubs, camera detections from U-Haul’s network of cameras, and third-party source data.
If you want reliable transportation planning, your biggest challenge is not collecting data, but turning the continuous noise from all those different data types into trusted signals so you can act on them.
Big Data programs fail during the Ingestion Phase. Transportation teams need both batch and streaming ingestion. Batch ingestion is for historical reporting and model training, while streaming ingestion is for Operational Decision Making (ODMs). Well-designed ingestion processes should follow a data contract (schema), use durable event IDs, support duplicate suppression, handle late-arriving events, and clearly separate raw event data from curated “gold” tables generated by a data cloud.
The runtime capabilities of big data enable decision-making at the moment (i.e., ‘NOW’). For example: traffic light changes to account for congestion; estimated time of arrival (ETA) updates triggered by missed checkpoints; and/or dynamic re-optimization when the temperature of a vehicle reaches a threshold. Supporting the runtime capabilities include windowing, stateful processing, and managing out-of-order data, in general, and, in particular, regarding stream processing. Enterprise companies typically use big data solutions via event buses with stream processors providing real-time aggregates or alerts to routing engines, dispatcher systems, and/or customer-facing applications.
Governance provides the fulcrum for safely using big data at scale. Most data analytics experts typically enforce four governance principles: lineage, role-based access controls, retention rules, and quality assurance (i.e., accuracy, completeness, and timeliness). Without governance, the resulting insights can drift, businesses will not trust the data, and sensitive location-related data becomes a liability.
| Capability | What it enables | Transportation example | Key design considerations |
|---|---|---|---|
| Ingestion (batch + streaming) | Reliable capture of multi-source events | Telematics + scan events + traffic feeds | Schemas, deduplication, late events, IDs |
| Streaming processing | Real-time decisions and alerts | Reroutes after incident; live ETA updates | Windowing, out-of-order handling, state |
| Curated layers in the data cloud | Consistent metrics and model features | “Single source of truth” for fleet KPIs | Data contracts, versioning, reproducibility |
| Governance + quality controls | Trust, compliance, safer scaling | Location privacy, audit trails, and access rules | Lineage, RBAC, retention, validation tests |
Route optimization across the transportation network
Route optimization is an ongoing process of selecting the optimal route and stop sequence, given real-world delivery constraints, and continually optimizing whenever those constraints change. It is more than just the “shortest path.” It is also about balancing time windows, driver hours, vehicle capacity, service times, and other relevant constraints within a diverse multimodal transportation environment, including last-mile, line-haul, and load-transfer operations.
Route planning is the first step of the process, by creating a preliminary route based on orders and static information. Route optimization leverages complex datasets to maintain routing efficiency and ensure adequate service levels for all customers. For example, if a truck arrives at a distribution center and scans a late load or encounters traffic/congestion, the system will modify the route by re-sequencing stops, rerouting the vehicle, or reassigning the delivery to another car, rather than allowing distribution center operations to fall totally off plan.
This is how intelligent transport systems and smart traffic data can increase the effectiveness of all modes of transport. Geospatial data from traffic feeds, incident notification, and travel time forecasting convert these raw signals into valuable data that assists in determining estimated time of arrival (ETAs) and route decisions. Together, when data also support dispatchers and automation, the public transportation system becomes a more resilient network, with missed windows reduced, vehicle use maximized, and fuel consumption minimized due to congestion.
Business benefits typically show up as:
- Lower cost per stop and fewer empty miles
- Better on-time performance and customer experience
- Faster response to disruptions with less manual intervention
- More predictable capacity planning across the transportation network
This compounds over time, making it easier to maintain service levels even in the face of network volatility and resulting in significant margin improvements from small daily savings. That combination transforms routing from an operational task into a strategic benefit.
Gain a competitive edge with our transportation and logistics software expertise.
Predictive maintenance using vehicle data and predictive analytics
Predictive maintenance delivers serious ROI in transportation projects. Instead of sticking to rigid schedules, teams use large amounts of data to spot problems early and fix them before they break down. This keeps vehicles on the road when people need them most. The beauty of it? Fleets generate a constant stream of valuable data, and most old-school programs barely tap into it. With the right analytics, you turn that data into smarter, more reliable operations.
Here’s what really matters when you build the model:
- Vehicle telemetry and fault codes. You’re looking at temperature, oil pressure, battery life, brake wear, odd shakes, and those cryptic trouble codes the system spits out. These vast amounts of data tell you what’s happening under the hood, right now.
- Operational context. Which routes are these vehicles running? How much weight are they hauling? Are they idling a lot, or stuck in stop-and-go? Weather plays a part, too. These details shape the stress each vehicle faces day to day.
- Maintenance history. Knowing what’s been fixed, which parts got swapped out, and how long similar vehicles usually last before breaking down — that’s how you spot patterns.
- Real-time signals. Sudden spikes or odd readings can signal a part about to fail or a safety issue brewing.
Many transportation systems already track this type of historical data for purposes such as accident detection and fleet management. Predictive maintenance just plugs right into this flow, using what you already gather to stay ahead of breakdowns.
As transportation professionals see firsthand, big data offers advantages such as fewer roadside breakdowns, safer operations, higher utilization, and greater opportunities for parts planning. Eventually, big data will enable maintenance to be leveraged to improve service reliability rather than being merely classified as an expense.
Demand forecasting and real-time delivery visibility
The two sides of the operational coin are demand forecasting and real-time visibility into your deliveries. Demand forecasting shows you how much capacity you will need, while real-time delivery visibility will show you whether or not your forecasted plan is being fulfilled in reality. Both of these rely on converting large amounts of data into actionable decisions that can be made quickly when utilizing big data analytics in the transportation industry.
Forecasting begins by identifying patterns in how people travel and how deliveries unfold. Transportation planners look at everything—order history, seasonality, promotions, weather, local events, and even the number of drivers available. They use all of this to predict what’s coming, right down to the zone and the hour. The most innovative models don’t just crunch the obvious numbers; they learn from the headaches too: which areas always seem to fall behind, which pickup spots cause issues, which routes get clogged. That’s big data actually doing something useful—pulling in scans, GPS hits, customer habits, carrier performance, curbside headaches, you name it. The goal? Get drivers, inventory, and time slots lined up before the day even starts.
Then reality sets in. That’s when real-time visibility really counts. With live tracking, dynamic ETAs, and exception management, you get a steady stream of real-time traffic data, including traffic jams, missed scans, dwell times, changes in stops—all of it flagging risks early so you can jump in before things go off track. It’s like having “data for every road.” You’re not just watching where the truck is; you actually know if you can still hit that delivery window. In smart cities, this gets even better. You can pull in congestion alerts, road closures, even curbside availability, and adjust ETAs or reroute on the fly.
When you use this data for both planning and execution, last-mile operations stop feeling so chaotic. You match capacity to real needs, flag issues before they snowball, and turn surprises into manageable situations instead of expensive headaches.
FAQ
Turning transportation data into measurable efficiency gains
In the modern transportation landscape, it’s about what you do with your data. When transportation professionals trust the data insights they get, they make more intelligent decisions on routes, head off breakdowns, and stay ahead of shifting demand. They move faster when things go sideways, too. Big data analytics revolutionizes things: it takes all those daily signals and turns them into absolute control. The result? Teams cut waste, keep services running smoothly, and grow with confidence, even as their networks become more complex.
Want to learn more about the application of big data and analytics in transportation planning? Contact Avenga, your trusted data collection and sustainable transportation expert.


Your business results matter
Achieve them with minimized risk through our bespoke innovation capabilities. Fill in the form below.