


Best data visualization service providers and agencies in 2026


February 3, 2026 10 min read
As data accumulates quicker than organisations can evaluate it, the volume of dashboards grows, inbox reports pile up, and the contents slip away between the spreadsheet and the boardroom. This is where effective data visualization can play a crucial role. The effective charting of data will convert an extended period of analysis to a five-minute conversation resulting in an informed decision being made.
Organisations have continued with their deepening analytical journey and are increasingly looking to use specialist partners to help them turn the raw data they receive into valuable insights. However, the most advanced data visualisation service firms today are not limited to providing charts and graphs; they create “visual narratives” by building analytical layers that can be used for data analysis at scale and by helping organisations find and understand patterns that would otherwise remain hidden. The role of these consulting firms and agencies in building a visualisation framework for businesses is immense, and many are focusing on developing data visualisation solutions for a wide variety of companies, from enterprise platforms to bespoke visual experiences.
Key takeaways for choosing data visualization partners
- In 2026, effective data visualization is more about making quicker, more transparent judgments that teams genuinely trust than it is about beautiful charts.
- To maintain dashboard accuracy as data sources expand, the top providers of data visualization services integrate BI engineering, UX, and governance.
- Seek out data visualization consulting firms that can manage pipelines, modeling, security, and scalable visualization solutions.
- The best data visualization companies do more than just “report”; they assist teams in identifying patterns, elucidating motivators, and implementing departmental discoveries.
What to look for in data visualization service providers
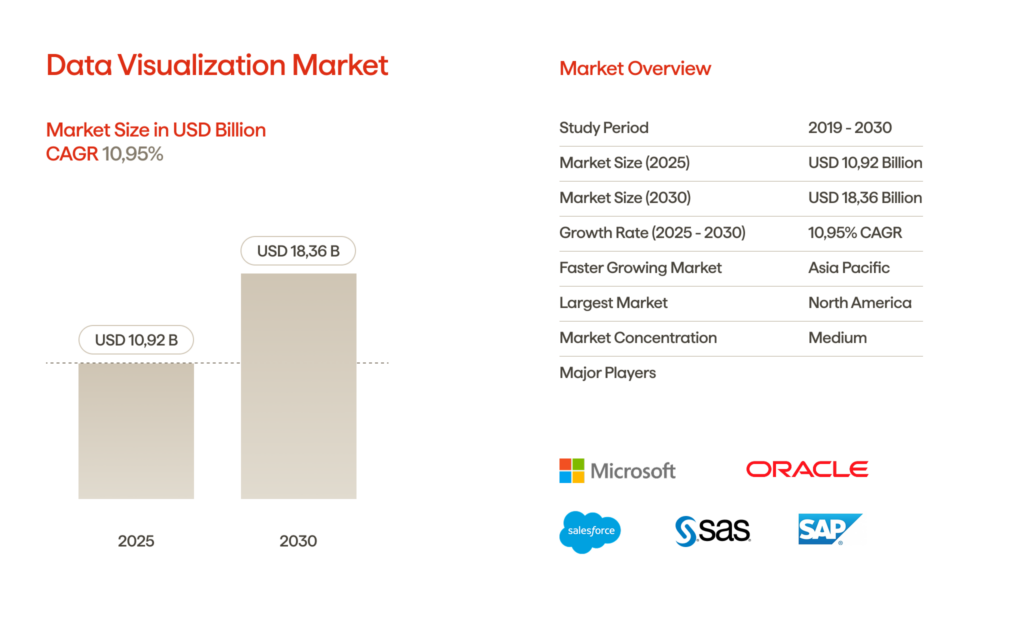
There has been a recent surge in growth in the data visualization market, driven by solid growth patterns. The data visualization market is expected to continue expanding at a compound annual growth rate (CAGR) of 10.95% over the next five years, reaching $18.36 billion by 2030, up from $10.92 billion in 2025.
As the realization of this change in the data visualization market becomes increasingly evident, the need for service providers and their products will also become more apparent. So, how will you decide which data visualization consulting companies will be the best fit for your organization?
Strong data visualization agencies focus on obtaining the business context before creating any visualization; thus, they typically start by gathering information through questions. To understand the types of KPIs, the processes that produce those KPIs, and how to make decisions within an organization, the specialist will ask clients about their KPIs. These processes affect them, and how decisions are made through a series of open-ended questions. In addition to this information, the data visualization delivery person must possess a technical skill set that includes business intelligence software such as Tableau, Power BI, and Looker, as well as the appropriate cloud-based data storage to utilize in conjunction with other tools.
This enables scalability as the amount of available data continues to grow.
Lastly, maintaining data quality, implementation performance, and access control are just as crucial as design, particularly in regulated environments; data governance and integration must be among the top priorities for data providers.
Now, let’s move on to reviewing the list of top data visualization service providers you can trust in 2026.
Avenga
By transforming complex data into straightforward, actionable insights for informed decision-making, Avenga helps the organisation become competitive through the digitalization of its business. This is accomplished via a business intelligence service, which brings control of speed and clarity into complex business enterprise data systems. By utilising visualisation technology and reporting analytics tools, Avenga enables organisations to evolve from manual methods of producing reports to leveraging favourable tools that provide more timely and accurate information, facilitating the execution of necessary business tasks.
Avenga provides data analysts/dataset scientists with a platform that allows them to analyse, explore, and predict changes in live transactional datasets. By using a modern business intelligence platform, data analysts/dataset scientists can make informed decisions about their organisations, by having both the historical records to review and access to the current status of their operations.
What we do as a business intelligence services company:
- BI dashboard development and data visualization
- Enterprise reporting automation
- Predictive analytics platforms
- Data warehouse architecture and modernization
- Data lake implementation
- Data governance and data quality control
Your business runs on data. We turn it into value. Avenga builds data and AI solutions that upgrade decisions.
SumatoSoft
Sumatosoft is based in Boston and specializes in data visualization and custom software development. With over twelve years of experience, Sumatosoft has been helping organizations convert complex data into actionable insights through data visualization. Their team aligns data visualization technology with the organization’s business goals and objectives.
The data visualization service provider collaborates with clients across multiple verticals, including retail, manufacturing, healthcare, financial services, and education, to deliver dashboards and reporting solutions that enable users to easily consume large amounts of diverse (and often unstructured) datasets.
TCS (Tata Consultancy Services)
More than 1,000 experts with a focus on data visualization work with TCS. They are experts at helping companies across various sectors transform unstructured, chaotic data into actionable business insights. The data visualization agency handles every step of the journey, starting with gathering raw data and analyzing it, to provide their clients with clear and understandable findings, all while utilizing our own data platform.
Edvantis
More than 500 knowledgeable consultants with expertise in big data, business intelligence, and data management work for the German consulting firm Edvantis. They work with a wide range of clients, from rapidly expanding startups to massive Fortune 500 corporations. Their goal? Help clients actually see what’s going on in their data, use it for predictions, and make smarter business decisions. They also provide actionable insights across all levels of raw and complex data by developing interactive dashboards using platforms like Tableau and Amazon Quicksight.
7Edge
7Edge is a Bangalore-based data visualization and analytics company focused on predictive analysis and complex data evaluation. The organisation has between 51 and 200 staff and has assisted businesses in relocating from standard business dashboards to advanced analytical capabilities. Businesses can utilize their cloud-based solutions to gain a deeper understanding of their customers’ behaviors and make more informed and strategic decisions.
Wildnet Edge
Wildnet Edge is an artificial intelligence-based data visualization and analytics company located in New York, with over 19 years of experience providing solutions throughout the entire data lifecycle. Wildnet Edge has a team of about 350 experts who build and run advanced data platforms. They help customers set up real-time data pipelines and scalable data lakes, making it easier to manage large datasets. From analytics and engineering to visualization and support, Wildnet Edge covers it all. They work with clients across various industries, including healthcare, finance, banking, retail, e-commerce, and manufacturing.
Algoscale
Algoscale helps U.S. businesses make sense of their data. With interactive dashboards and real-time data tools, Algoscale simplifies the process for companies to track KPIs and make informed decisions without getting lost in the details. Algoscale offers visualization solutions of various types, including geospatial and time series, and tailors each solution to the specific needs and context of the business, as well as the target audience. The company’s data visualization solutions carry a strong enterprise-grade level of security, are not tied to a specific tool vendor, and are designed based on a high level of domain expertise.
Kanerika Inc.
Kanerika Inc. transforms raw data into actionable insights for its clients’ businesses. Their global reach enables them to serve clients in every corner of the world, making them experts in data and business intelligence. As a Microsoft solutions partner for data & AI, Kanerika utilizes Microsoft Fabric, Power BI, and Databricks to modernize clients’ data systems and improve analytics. Their team handles everything from setting up business intelligence platforms to upgrading data and using AI for deeper analysis.
Indium Software
Indium Software provides business intelligence and data visualization services to organizations modernizing their data infrastructure. With a unique blend of strong technical engineering and a dedicated process for applying design thinking, Indium focuses on delivering analytics solutions that are both user-friendly and technically sound.
Indium handles every part of the analytics process, from data ingestion and modeling through to visual reporting and fine-tuning. They also design powerful dashboards that can handle large amounts of data without slowing down. Indium utilizes top BI software, including Microsoft Power BI, Tableau, and QlikView, allowing clients to gain a clear and in-depth view of their data.
Chetu
Chetu builds custom dashboards, analytics, and business intelligence tools for companies that require a more personalized solution than an off-the-shelf solution. Their dashboards don’t just look good—they actually fit right into your systems, pulling data from all those scattered sources and turning it into something you can finally make sense of. Chetu provides the complete data visualization process (ETL, data integration, etc.), as well as the production of automated reports and the delivery of analytic results. Their experience includes, but is not limited to, the financial, medical, and retail industries.
SG Analytics
SG Analytics offers a large client base, both now and in the future, by combining cutting-edge solutions (Snowflake, Databricks, AWS, and Azure) with intelligent analytics and data visualization. They currently work in various industries, including healthcare, banking and financial services, insurance, media and entertainment, and technology. Their headquarters are located in Pune, India. Through contextual research and engineering, SGA explores predictive analytics, business intelligence, data warehousing, artificial intelligence, and machine learning to help clients better understand their data and make informed decisions.
Sisense
Sisense is a New York-based provider of a data visualization tool with a focus on real-time reporting and embedded analytics through its proprietary analytical technology. They enable customers to integrate their dashboards with their products and internal tools, providing greater business intelligence and ease of integration.
Sisense also supports software, B2B services, and technology-based companies through advanced data visualization capabilities designed for all users and team sizes, enabling users to derive insights, optimize workflows, and make data-driven decisions quickly and efficiently.
FAQ
Selecting the right data visualization partner for long-term value
In 2026, having a reliable data visualization consulting company as your partner is one of the best things leaders can do to safeguard their growth. By the way, the latest data indicate that visual information constitutes approximately 90% of the data relayed to the brain, making data visualization essential for practical marketing efforts. Visual data helps experts recall showings more effectively than written text, contributing to better results and enhancing the marketing decision-making process. Long story short, having a list of companies to choose from is a strategic advantage you can use to fuel your growth in 2026 and beyond.
To learn more about data visualization in 2026, reach out to Avenga, your dependable source for data intelligence.

Real-world evidence (RWE) in pharma: Use cases

How to automate clinical trial budget: Modern clinical research management

Your business results matter
Achieve them with minimized risk through our bespoke innovation capabilities. Fill in the form below.