


AI anomaly detection: systems, algorithms, and techniques explained


July 28, 2026 24 min read 228 views
Discover how Machine Learning–powered anomaly detection helps businesses proactively identify fraud, reduce losses, and enhance operational security through real-world applications and expert insights.
Businesses generate massive amounts of data every day, making it increasingly difficult to identify suspicious activities, operational issues, and potential risks manually. Anomaly detection systems use Machine Learning algorithms to analyze this data and uncover unusual patterns that may indicate fraud or other critical events.
In this article, you’ll learn how anomaly detection works, explore the main types of anomaly detection algorithms, and discover the key stages of building an anomaly detection system. We’ll also look at real-world case studies showing how Machine Learning helped businesses detect fraud earlier, reduce losses, and improve operational efficiency.
How does anomaly detection help businesses prevent fraud?
Anomaly detection helps businesses identify fraudulent activities by analyzing large volumes of data, recognizing unusual patterns, and detecting outlier behavior that may indicate fraud. By identifying suspicious activities early, anomaly detection systems allow organizations to prevent potential losses and respond to risks before they escalate.
Every day, enormous amounts of data are created. In 2025, the global volume of data created and consumed reached around 181 zettabytes, which equals approximately 181 billion terabytes. As businesses continue to digitize their operations, they need to process and analyze increasingly larger amounts of data across different systems and platforms. As a result, organizations have to adopt more advanced approaches to manage this data, identify risks, and keep up with market competition.
Nevertheless, the speed of digital transformation comes with its risks and the entire endeavor can cause more harm than good. As the company servers are loaded with tons of data, handling it properly with advanced anomaly detection tools can pose a huge challenge for a business. Fraudulent activities have the potential to collapse the entire system and this can only be prevented when there’s a system to detect anomalies and outlier activities. Therefore, it is essential that fraud detection policies are considered in the design stage of the system, so they won’t weaken the overall risk profile of a business.
Fraudulent activities have the potential to collapse the entire system and this can only be prevented when there’s a system to detect anomalies and outlier activities.
The good news is that rigorous anomaly detection mechanisms can be built to safeguard organizations against fraud-related losses and damages. As there are hundreds of ways to do fraud, it’s quite difficult to gather the information about all of the potential anomalies in a dataset beforehand. Yet, since the majority of user actions are “normal”, this information can be captured and the outliers in the data can be identified.
The most important task of the anomaly detection system is to capture fraudulent activities proactively, so that they can be promptly acted upon and won’t cause damages and losses for the company.
In the next section of this article we will take a deeper look into the types of anomaly detection algorithms and understand in which cases each of these algorithms can be applied.
Types of anomaly detection
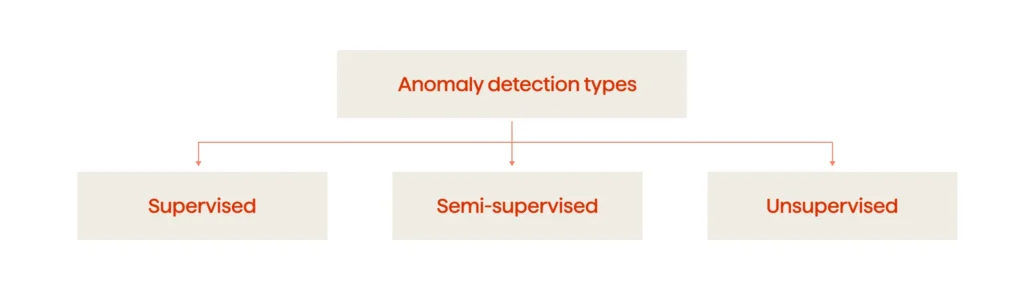
There are three types of anomaly detection algorithms: supervised, semi-supervised, and unsupervised. All these algorithms are Machine Learning techniques that are especially effective when they are needed to detect fraud within a huge volume of data, which is most likely humanly impossible.
Supervised anomaly detection
Supervised anomaly detection techniques involve training a classifier on a labeled dataset, where the data is labeled as “abnormal” and “normal”. When a new data point appears, it needs to first be classified.
The main benefit of a supervised anomaly detection model is that it produces highly accurate results.
Still, supervised anomaly detection warrants acquiring large amounts of normal and abnormal examples. Capturing such a dataset is complicated and laborious, as the anomalous data points are scarce. In addition, as there are many distinct types of anomalies in any domain, the new anomalies can differ substantially from the ones detected before. Therefore, it may be hard for supervised anomaly detection algorithms to learn from the anomalous data points and how they look.
Unsupervised anomaly detection
In contrast to supervised anomaly detection, in unsupervised anomaly detection there are no labels or classifications of data to train upon. Basically, unsupervised anomaly detection classifies a data point as an anomaly if it substantially deviates from the rest of the data. This methodology is used in cases where the real anomalies are few and differ significantly from the normal instances. However, this is not always the case, and the algorithm can identify some instances as anomalies, but in fact they are not anomalies.
The benefit of unsupervised anomaly detection techniques is that there’s no need for data scientists to label data in a dataset.
The disadvantage of unsupervised anomaly detection is that the algorithm doesn’t improve its performance over time.
Semi-supervised anomaly detection
Since labeling data is usually a time-consuming and expensive procedure, in many cases, there are a lot of unlabeled instances, and few labeled instances. Some algorithms can deal with partially labeled training data. They are referred to as semi-supervised learning algorithms. Most semi-supervised anomaly detection algorithms are a combination of supervised and unsupervised detection algorithms. They are trained in an unsupervised manner, but then the system is tuned using supervised learning techniques.
So, semi-supervised learning overcomes one of the supervised learning problems when there is not enough labeled data. However, when applying semi-supervised learning, there are certain assumptions related to smoothness, clustering, and manifold, so one must ensure they are not violated.
Each of the anomaly detection algorithms has its own applications. Supervised algorithms are great when the anomalous and non-anomalous data points are labeled as they have high prediction performance. When there are no labels in the data, only unsupervised anomaly detection algorithms can be used. Still, semi-supervised anomaly detection algorithms are better than supervised ones in a number of cases when:
- There are not enough anomaly labels
- There are too many subgroups of anomalies
- The data is highly imbalanced
In the case studies presented at the end of this article, we’ve used semi-supervised and unsupervised anomaly detection algorithms.
In the next section you will read about the phases of the anomaly detection process.
The anomaly detection process
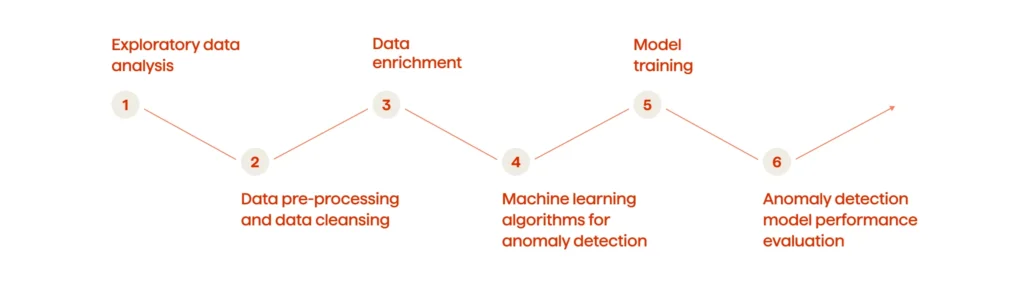
The anomaly detection process consists of the following phases:
- Exploratory data analysis
- Data pre-processing and data cleansing
- Data enrichment
- Selecting Machine Learning algorithms for anomaly detection
- Model training
- Anomaly detection model performance evaluation
In the subsequent paragraphs we will describe the stages of every phase and the techniques that are most often used for anomaly detection.
1. Exploratory data analysis
Exploratory data analysis is an initial phase during the anomaly detection process as it helps to perform initial research in the data to discover patterns and outliers in the data. It defines how to best manipulate data sources to get information about the anomalies and the relationships between them. During the data exploration stage, a data scientist visually explores the data and identifies possible outliers in the data. These outliers can potentially signal fraud. The frauds have their distinctive features, such as a number of transactions, behavioral time patterns, accumulation of reward patterns, etc.
While performing exploratory data analysis, data scientists can test their hypotheses and assumptions and then determine the most appropriate anomaly detection techniques.
To find out more about how we do exploratory data analysis at Avenga, please contact us.
2. Data pre-processing and data cleansing
In the case of supervised anomaly detection approaches, data pre-processing and data cleansing are one of the most important phases that provide the Machine Learning algorithm with the proper dataset to learn on. The impossible data combinations, out-of-range values, and missing data can generate misleading results.
Proper data pre-processing ensures that the data quality is high, which in turn ensures the results are accurate.
The anomalous examples identified during the data cleansing stage are important samples for learning.
3. Data enrichment
Data enrichment involves enhancing and appending the dataset with relevant additional information. It includes supplementing missing or incomplete data, as well as preparing and structuring the data for Machine Learning algorithms. Data enrichment helps to process the multi-structured data more efficiently, and improves the accuracy and the quality of the anomaly detection results.
Data enrichment also includes collecting data from third-party vendors or web scraping, thus adding publicly available datasets. An example would be the LexusNexus credit card scores, identity checking, and information from social profiles.
4. Selecting Machine Learning algorithms for anomaly detection
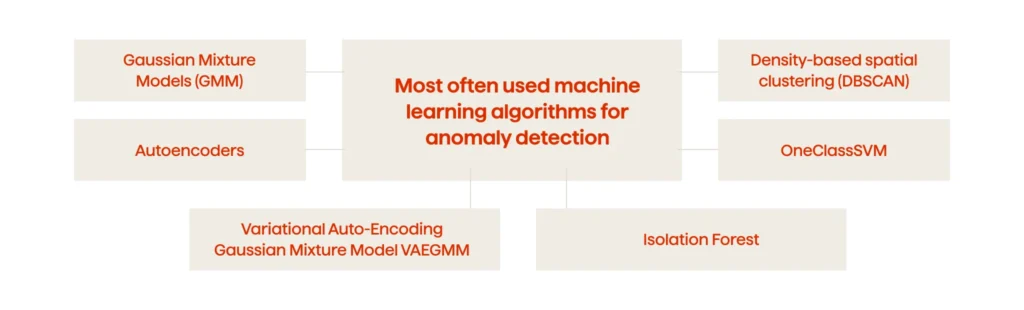
Once having a better understanding of what patterns to look for, a data scientist identifies the most appropriate Machine Learning algorithms that can aid with anomaly detection. It should be pointed out that anomalies in high-dimensional datasets may follow quite complicated patterns and might be difficult to detect. That is why ML algorithms are highly effective in determining anomalies in big data sets. In particular, the Autoencoders, Variational Autoencoders, GMMVAE, Isolation Forest, OneClassSVM, and DBSCAN are the most often used Machine Learning techniques to detect anomalies. In the subsequent paragraphs we’ll dive deeper into these algorithms and explain how they work.
Gaussian Mixture Models (GMM)
Gaussian Mixture Models (GMM) are used to build clusters. GMM is an unsupervised Machine Learning algorithm that is utilized to cluster unlabeled data. In particular, GMM performs a soft classification of data points, thus providing the information on which data point belongs to what cluster in addition to the probability at which the given data point may belong to each of the possible clusters.
Autoencoders
Autoencoder is a neural network with the same input and output variables. The main task of autoencoders is representation learning: setting an encoder and decoder as neural networks, and learning the optimal encoding-decoding scheme using an iterative optimization process. After every iteration, the autoencoder is fed with the data. Then, the produced input is compared with the initial data and the neural network is used to calculate the error (loss) function according to the neural network’s weight.
The purpose of using an autoencoder network is to capture the correlation between the different variables. First, the autoencoder algorithm is trained on a dataset that represents “normal” data points. Next, it compresses and reconstructs the input variables. The following phase is dimensionality reduction, during which the autoencoder network learns the interactions between the various variables and data points, and reconstructs them back to the original variables at the output stage.
As this process takes place, one can start to see the growing error in the autoencoder network reconstruction of the input data points. By monitoring this error, a data scientist can get an indication of the anomalies in the dataset.
Variational Auto-Encoding Gaussian Mixture Model (VAEGMM)
The Variational Auto-Encoding Gaussian Mixture Model (VAEGMM) anomaly detection model uses a variational autoencoder (VAE) to provide the probability distribution for each attribute. First of all, let’s dive deeper into what a variational autoencoder does.
Variational autoencoders are built in such a way so as to produce a statistical distribution (a range of possible values) that enforces a continuous and accurate data representation. Instead of building a usual encoder that outputs a single value to represent every data point, variational autoencoders represent a probability distribution for every data point. This methodology is the best one for detecting anomalies.
The VAEGMM model utilizes the benefits of both the Gaussian Mixture Model and variational autoencoders. It is used to improve the unsupervised clustering performance.
So to simplify it: first, the autoencoder generates a latent representation of the data; then, this representation is fed into GMM to perform a density estimation.
The VAEGMM algorithm significantly outperforms conventional anomaly detection techniques.
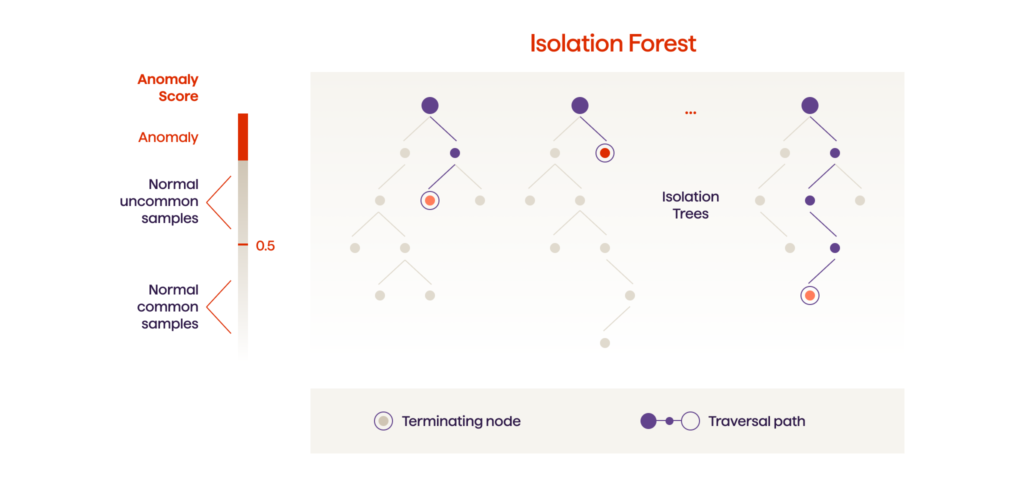
Isolation Forest
Isolation Forest is an unsupervised and nonparametric algorithm based on trees. Isolation Forest is very similar to Random Forests and is built based on an ensemble of decision trees for a given dataset.
In particular, this algorithm is very effective in carrying out anomaly detection in high-dimensional datasets. It helps to identify anomalies using the isolation methodology, where abnormal data points are isolated from the dataset. The Isolation Forest algorithm is especially useful as it does not require conducting the time-consuming process of normal data point profiling or building a model or cluster.
Isolation Forest perfectly deals with the datasets that have a considerable number of irrelevant attributes, as well as in situations where a training set doesn’t have any anomalies.
OneClassSVM
OneClassSVM is one more unsupervised Machine Learning g algorithm for anomaly detection. It classifies new data as identical or distinct from the training dataset. OneClass SVM is an extension of the SVM (Support Vector Machine) learning algorithm that allows training a classifier when anomalous data is absent. The algorithm trains itself to treat a certain number of normal data points as if they belong to anomalies. This enables the setting of a boundary between the normal and anomalous data points.
While the standard SVM separates the two classes using a hyperplane with the largest possible margin, one-Class SVM uses a hypersphere to encompass all of the instances. The “margin” refers to the outside of the hypersphere; so, by “the largest possible margin“, we mean “the smallest possible hypersphere“.
Density-based spatial clustering (DBSCAN)
Clustering analysis is used to group the data into clusters. It is one of the most popular techniques in unsupervised Machine Learning. However, clustering analysis is not an automatic task, but rather an iterative process of knowledge discovery that involves trial and failure. We used a density clustering model called ‘density-based spatial clustering of applications with noise’ (DBSCAN). This algorithm is used to group together data points that are close together (data with many nearby neighbors) by ranking as outliers the data points that lie alone and whose nearest neighbors are far away. The DBSCAN algorithm perfectly suited our client’s case, as the task was to identify fraudulent activities by company employees who used their loyalty cards to accumulate rewards instead of customers; see the case study near the end of this article. It’s one of the most common clustering algorithms and it is especially efficient for spectral clustering and finding connected data points on the asymmetric reachability graph.
5. Model training
Once the anomaly detection algorithms have been chosen, the anomaly detection model helps to obtain predictions about the new anomalies. To make it work, the anomaly detection model first needs to be trained. In the supervised anomaly detection approach, the model is trained by correct answers that are called target attributes. The anomaly detection algorithm finds patterns that represent input data in order to target attributes and then outputs an algorithm that depicts these patterns. In the unsupervised anomaly detection setup, there are no target variables.
In the case study that will be described further in this article, our task was to identify the fraudulent cards and the fraudster’s locations. We’ve started with the analysis of the data itself (without labels) and then added some information about fraudsters’ locations in the learned clusters to fine-tune the algorithm. Using supervised anomaly detection techniques was quite a time-consuming endeavor, as every fraud needs to be validated through video recordings. Therefore, Avenga’s data science team used unsupervised and semi-supervised anomaly detection algorithms, as they were the most suitable for the client’s use case.
6. Anomaly detection model performance evaluation
After the anomaly detection model has been trained, the results it produces have to be evaluated so as to determine the accuracy of the model’s performance for the future on yet unseen data. There are two approaches to evaluate an anomaly detection model’s performance:
Holdout
The holdout approach is often used to assess the anomaly detection model’s performance because of its speed, flexibility, and simplicity. The goal of the holdout evaluation technique is to examine the model with the different data that it was trained on. This technique produces a fair estimate of the quality of the model. To follow the holdout approach, the dataset is divided into three subsets:
- Training set, which is used to build predictions.
- Validation set, that is used to evaluate the model’s performance in the training stage. The validation set is used for fine-tuning a model’s parameters and thus choosing the best performing model.
- Test set, or unseen dataset, is used to evaluate the future model’s performance. If the model has memorized all the noise of the training set and fits too closely into it, it might become overfitted. Overfitting is a Machine Learning concept when the model cannot generalize well to new data and the model’s performance is not as expected.
K-fold cross-validation
The cross-validation evaluation technique is used to assess the model’s performance on an independent data sample. This technique is often used to evaluate the Machine Learning model’s performance on unseen data and estimate how well it can make predictions on new data.
It’s always better to have a bigger dataset for the training anomaly detection model. When we reduce the volume of a dataset, there’s a risk of missing valuable patterns. K-fold cross-validation is the prevailing method, because it’s simple to understand and it produces a less biased evaluation on how well the model performs, especially if compared with other methods, such as the usual train & test split.
The standard process of the K-fold cross validation is the following:
- Dataset randomization
- Dataset splitting into K groups
- For every group:
A hold out and test dataset is chosen
The remaining groups form a training dataset
The model is fitted into the training set and assessed on the test set
The assessment score is saved - The model’s performance is reviewed using a sample of model assessment scores
In the next sections we will introduce two anomaly detection use cases that the Avenga teams have worked with.
Case study 1: how to develop an anomaly detection system that shortens claim resolution time by 30%
The Avenga Data Science team developed a comprehensive anomaly detection system for the world’s leading on-demand insurance platform, Trōv. The solution detects fraudsters (suspicious clients) before insurance claims are paid and helps the company to prevent fraud-related losses and damages.
During the first step, the team used unsupervised Machine Learning techniques to detect suspicious groups of users before the labeled data was gathered.
At the next step, the team proceeded to feature engineering (feature is a signal of a fraud). The features include the submitted insurance claim frequency, denied and cancelled claims, claim size, etc.
After that, supervised Machine Learning techniques, along with neural networks, were used to learn suspicious patterns from samples and detect them in new cases based upon the labeled dataset.
The anomaly detection solution Avenga’s team developed works in the following way:
1. The customer submits a claim.
2. The Machine Learning model generates features (signals) that may indicate fraud. Such signals include, but are not limited to the following features:
- Identity signals (threat metrics, credit card score):
- ID checks, Email/Mobile Risk, Sanctions and Deceased Warning, number of devices a customer was seen on, fraud rate of customer’s IP, etc…
- Traditional signals:
- Number of protections they made in their first week
- Number of failed transactions
- Excess levels
- Payment method signals:
- Similarity between a customer’s name and billing name
- Behavior signals:
- Time spent on the page, or the length of time between quoting and buying a policy (like if a fraudster is using a script to scrape a webpage vs normal browsing activity)
3. The anomaly detection model predicts scores for each signal (feature) and gives each claim a risk score on a scale of 0 – 1.
4. The anomaly detection model sets thresholds for what proportion of claims should be accepted/denied/manually reviewed.
The benefits of this solution were the following:
- Shortened the claim resolution time by 30%, thanks to a fraud detection system.
- Lowered the loss ratio by detecting suspicious behaviors before they do any harm; in the insurance industry the loss ratio means the ratio of losses to premiums earned.
- Achieved better operations efficiency due to automated screening.
- Optimized costs due to minimum review time and fraud processing.
- Accelerated payments on genuine transactions/claims.
- Improved the customer experience.
Case study 2: how to develop an anomaly detection system that identifies 94% of frauds
The Avenga team developed an anomaly detection model for a client that has several hundred branches all over their country. The company implemented loyalty program cards that enabled company customers to accumulate points when buying goods from a set of shops.
The company faced some loyalty program fraud cases that limited the client in establishing a lasting and profitable bond with customers and threatened customer retention.
The project’s goal was to review how people use the loyalty cards in order to find fraudster behavior patterns earlier, as well as the types of fraudsters based on the possible fraud features (number of transactions, behavioral time patterns, accumulation of points patterns, etc.).
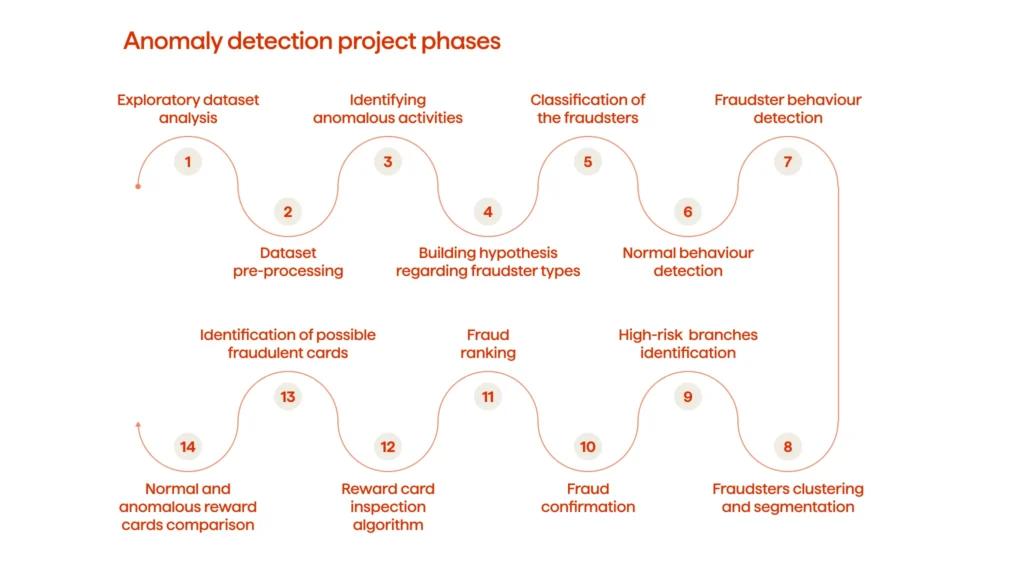
The anomaly detection project consisted of the following phases:
- Exploratory dataset analysis
- Dataset pre-processing
- Identifying anomalous activities
- Building a hypothesis regarding fraudster types
- Classification of the fraudsters
- Normal behavior detection
- Fraudster behavior detection
- Fraudsters clustering and segmentation
- High-risk branches identification
- Fraud confirmation
- Fraud ranking
- Reward card inspection algorithm
- Identification of possible fraudulent cards
- Normal and anomalous reward cards comparison
The Avenga Data Science team analyzed the company’s dataset which contained the data of several hundred thousands of users and came up with six possible types of fraud. They were based on the number of transactions, behavior time patterns, spending and accumulation of points behavior, etc.
Using anomaly detection algorithms, the company’s users were segmented into fraudster and non-fraudster classes. Key features and a description were built for the fraudster behaviors. Classifying the atypical user’s behaviors helped to quickly identify fraudsters into one of the six fraud types.
The team discovered valuable insights into the different frauds using the loyalty cards. For example, fraudsters check their card’s balance way too often; normally, people would not do this. Additionally, a lot of fraud buyouts are typically made at night time and these transactions reflect a large amount of money made in a short time.
To identify fraudsters, the team built an anomaly detection model that utilized VAEGMM (Variational Auto-Encoding Gaussian Mixture Model). The other approaches, based on Isolation Forest, OneClassSVM, and Clustering (DBSCAN) unsupervised machine techniques, were tested during the model selection phase. The later approaches did not perform as well when compared to VAEGMM, which is why they were not chosen.
The system helped to identify all of the fraudster reward cards, as some of the fraudsters used different cards for different transaction types. As a result, the client received several reports:
- a report on the locations where the frauds were happening
- a report on the reward cards used for fraudulent transactions
- a report on other cards the fraudsters used for collecting the rewards
The anomaly detection POC (proof of concept) detected fraud with high accuracy resulting in increased user satisfaction, enhanced security and improved workflows.
Challenges of anomaly detection
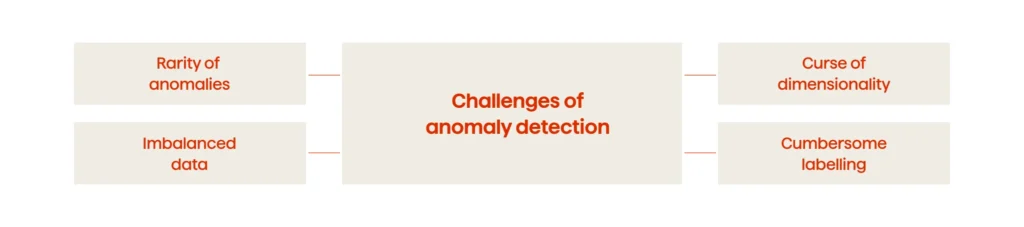
The rarity of anomalies
Detecting anomaly activities such as fraud, network intrusion, and other suspicious activities might be difficult as the abnormal patterns are rare and generally don’t appear frequently in the dataset. In addition, they are sparse and dissimilar in many ways, which prevents the normal data preparation techniques from being effective.
In addition to being rare, abnormal data points are also not represented equally. For example, after applying a classification technique to the dataset, a data scientist can obtain a model with results that are 85% accurate. However, once investigated further, it turns out that 85% of the data points belong to only one class. This is a perfect illustration of what is considered imbalanced data and how it can produce inaccurate results.
Curse of dimensionality
In big datasets that consist of multiple numbers of attributes and features, the volume of data that needs to be generalized is huge. This results in data sparsity, where data points are more scattered and isolated. Data sparsity creates high noise levels through multiple irrelevant variables that cover up the true anomalies. This challenge is called the “curse of dimensionality” or the multimodality in other sources, which creates an obstacle for anomaly detection techniques.
Cumbersome labeling
When analyzing data for anomalies, it’s difficult to obtain accurately labeled data that represents all the types of anomalous behavior. That’s why labeling is often conducted manually, which makes it expensive as it requires high domain knowledge. It’s also a tedious process as it’s quite time-consuming.

Avenga anomaly detection services
The Avenga AI & Data Science team is ready to help your organization detect anomalies and fraud-related activities. If you enlist our help, several Avenga data science experts will be assigned to your organization for a predetermined period (from 1 to 3 weeks), based upon purchased consultancy hours, to assist with the exploratory data analysis. Avenga will also assign a Senior Data Scientist as a resource to your company for the entire project duration. Furthermore, a Project Manager will support you and the team with planning and organization tasks.
The following are the key fraud detection project milestones:
- Data pre-processing and data cleansing
- Data enrichment
- Selecting Machine Learning algorithms for anomaly detection
- Model training
- Anomaly detection model performance evaluation
Fraud prevention is never excessive. Harness the power of Machine Learning for anomaly detection with Avenga. By partnering with an experienced technology vendor like Avenga, you can be sure that fraud in your company can be prevented.

FAQ
Conclusion
Anomaly detection gives businesses a proactive path to fraud prevention. Instead of discovering fraud weeks or months after it occurs, Machine Learning models (supervised, unsupervised, or semi-supervised, depending on the use case) can identify suspicious patterns as they emerge, protecting revenue and operational integrity before losses accumulate. Building an effective system requires a well-thought-out process: exploratory data analysis to establish initial hypotheses, data cleansing to eliminate misleading inputs, enrichment to improve model accuracy, and meticulous testing to confirm the model performs reliably on unseen data.
Reduce fraud exposure and accelerate claim resolution with anomaly detection built for your data. Contact our team to explore what’s possible for your business.


Your business results matter
Achieve them with minimized risk through our bespoke innovation capabilities. Fill in the form below.